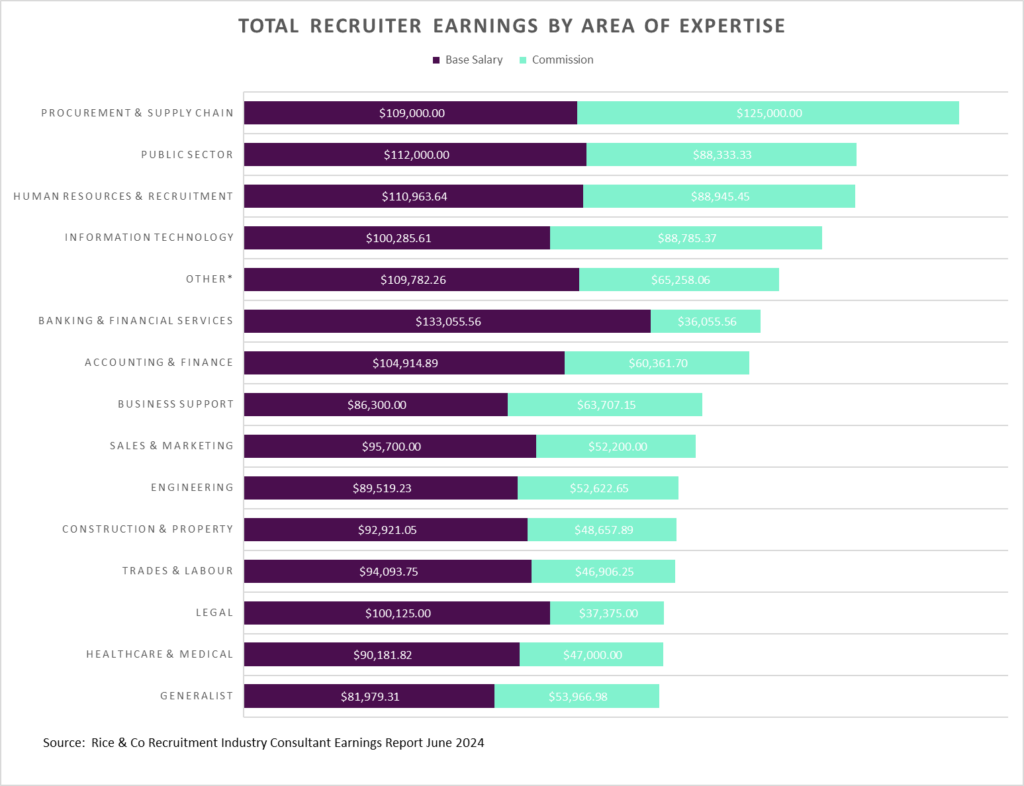
You want to get the highest base salary as a kiwi agency recruiter? Get onto a Banking & Financial Services desk. Or you want the chance to bill the most fees, and have the highest overall earnings? Then find your way onto a Procurement & Supply Chain desk. Or maybe you want to challenge yourself to compete against the largest number of recruiters but still in one of the most lucrative sectors? Join the throngs of kiwi agency recruiters plying their trade in IT.
These are just small snippets of data generated by the RICE (Recruitment Industry Consultant Earnings) Report which we rolled out as part of our Rice & Co rebrand launched at a PowWow almost a year ago. The Report asks agency recruiters to anonymously enter what desk they recruit on, how many years’ experience they have, and then some financial questions on base salary, billings and overall earnings.
Thanks to the 421 (and counting) agency recruiters to have entered their vital statistics so far, the Report has revealed some interesting data on our agency recruitment industry that was previously limited to anecdotal evidence, hearsay and ‘educated guesswork’.
Average annual billings
$485,406
Average base salary
$98,060
Average overall earnings
$167,109
Now before you compare your own current performance against these headline figures and wonder where it all went wrong, bear in mind this is data produced during stronger economic times than we currently find ourselves in, with large chunks of data supplied from recruiters at the more senior end of experience levels, as well the largest number from one sector being IT recruiters, which was (and will one day be again) the most lucrative of sectors barring Executive Search.
So, with that in mind, let’s break it down some more.
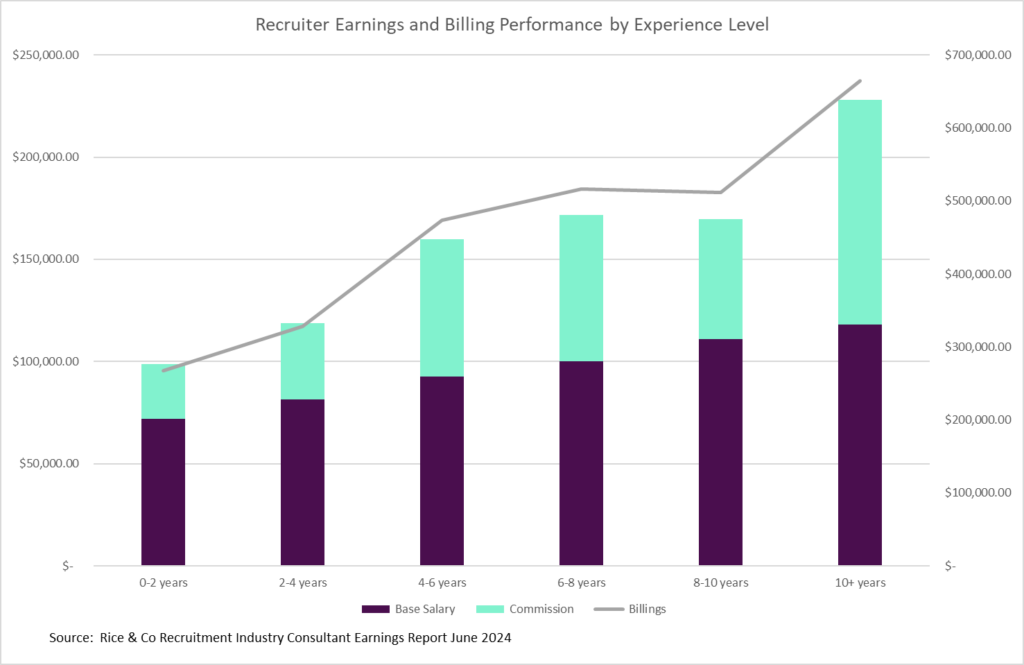
Agency Recruiter Earnings vs Billings by Years’ Experience


As you might expect, the more experience in recruitment, the higher the base salaries and better the billings performances. The dip around the 8-10 years mark is interesting, and maybe shows the impact of successful recruiters moving into managerial roles where earnings are tied more to team performance than individual brilliance.
Agency Recruiter Earnings by Industry
We can also look at the data based around the recruiter’s specific area of expertise, or what desk they are running.

*Other includes industry sectors with 5 or fewer responses and includes Executive, Education, Digital, Call Centre & Customer Service, Manufacturing & Operations, Hospitality & Tourism, Retail, Advertising, Arts & Media, Transport & Logistics, Agriculture, Scientific and Architecture.
Thanks to everyone who has entered their data so far, and seen how they stack up against their peers recruiting in similar sectors, or with similar levels of experience. The more data we get, the better this report will be, so click the below link to give it a whirl yourself and remember it is completely anonymous.
https://rice.co.nz/rice-report/
RICE Report for In-House Recruiters
Whilst this post is just looking at data extracted for recruiters from NZ’s agency side of things, we are also gathering data for in-house recruiters too. For our comrades out there in various TA teams across NZ, just flick the switch at the top of the Report to point at In-House Recruiter Report and, once we have enough data from that side, I will do a follow up post on that too.
Thanks to my team at superHUMAN Software who built this report, and the other awesome tools (Commission Comparison tool and Commission Plan builder) that you can also find on Rice & Co. Looking at some of these numbers shows what huge potential there still is to build a rewarding career in recruitment and, whilst it may feel tough going out there currently, proof that better times will doubtless come back around again soon.


